
Intermarkets' Privacy Policy
Donate to Ace of Spades HQ!
aceofspadeshq at gee mail.com
Buck:
buck.throckmorton at protonmail.com
CBD:
cbd at cutjibnewsletter.com
joe mannix:
mannix2024 at proton.me
MisHum:
petmorons at gee mail.com
J.J. Sefton:
sefton at cutjibnewsletter.com
Ace of Spades Pet Thread, July 18
Gardening, Home and Nature Thread, July 18
Saving the Shire
The Classical Saturday Morning Coffee Break & Prayer Revival
Daily Tech News 18 July 2026
Look At Me I'm ONT
Friday Cafe
The Same Media That Pushed Hillary's Fake Opposition Research About Russia Collusion For Six Years Can't Believe Trump Is Alleging Election Irregularities
Scott Bessent: A Deranged Leftist Attempted to Assassinate Me Shortly After I Became Secretary of the Treasury
The New Republic: Don't You Understand You're Forcing Us Lefties to Murder You?
Jon Ekdahl 2026
Jay Guevara 2025
Jim Sunk New Dawn 2025
Jewells45 2025
Bandersnatch 2024
GnuBreed 2024
Captain Hate 2023
moon_over_vermont 2023
westminsterdogshow 2023
Ann Wilson(Empire1) 2022
Dave In Texas 2022
Jesse in D.C. 2022
OregonMuse 2022
redc1c4 2021
Tami 2021
Chavez the Hugo 2020
Ibguy 2020
Rickl 2019
Joffen 2014
maildrop62 at proton dot me
How Much is a Gallon of Gas? [Joe Mannix]
It's a lot, and it's far too much.
With that out of the way, let's look at it comparatively over time and try to dig deeper. The price of gas has consequences on everyday life for all of us. (Diesel does, too, of course, and in even bigger ways given its place in our transportation system, but this post is about gasoline) We use gas to go shopping, to mow the lawn, to go to work, to head out on the town. When the price of gas skyrockets like it has, it implies tremendous consequences on quality of life. To determine how much gas costs today, we can use dollars like they do at the gas pump but we can also use other measures - namely time. In other words, how much do you have to work to buy that gallon of gas?
This approach also varies by locale. The price of gas varies, as do wages. To work this out, let's use four factors over time:
1. The minimum wage
2. The median wage
3.The price of gasoline
4. Location
For the time periods, let's use 1980 (a peak), 1995 (a lower average), 2008 (a peak) and 2022 (a peak).
So how does this look for five locations? Let's see.
Here are two tables, one with raw data and one with the price of gasoline in terms of income and inflation. There will be a lengthy text block at the end of the post with sources and other notes.
Table 1
Dollar cost information for each region in each year, where data are available. "Min" is minimum wage, "Med" is median wage, "Gas" is the cost of regular gas per gallon.
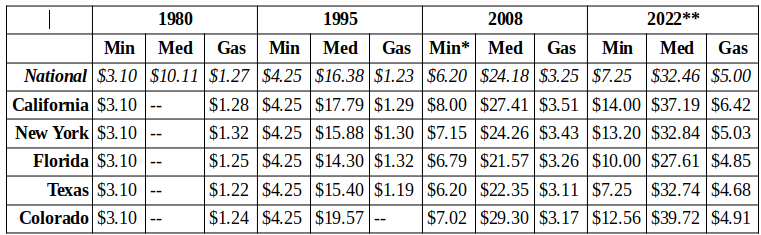
** Income data is from 2020, the most recent year with available data. The 2022 comparative story is slightly less bad than the calculations imply, as there was a pay rise in 2021 - we just don't know how much.
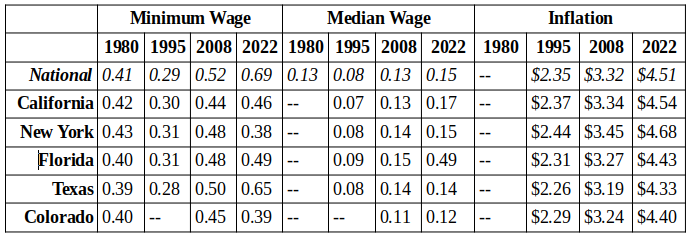
Table 2
The price of gas in terms of hours worked at minimum and median wages and based on inflation since 1980.
1980 was a long time ago and the time since then makes remembering the reality more difficult, if you were even fully aware of and hurt by the high gas prices. 2008 is a lot more recent and most people can actually remember what it was like and how much it hurt.
Excluding New York and Colorado, gas prices in minimum wage terms is anywhere from 10%-68% more expensive than it was in 1980, and 4.5%-32% more than it was during the last spike in 2008. New York and Colorado, with their higher minimum wages and lower gas taxes than California, are the exceptions and have actually seen relative gas prices drop in this group by 21% and 13% as compared to 2008, respectively.
In terms of median wages, however, not a single state sampled is seeing cheaper gas. Only one state - Texas - has seen the gas price in terms of the median wage hold steady. We don't have good median income data for the states in 1980, but the national level on a like-for-like basis shows that gas is 15% more than it was in 1980. Gas is also at least 7% more than it "should" be based on the cumulative rate of inflation since 1980. Taxes, of course, have not been stable and inflation is a fairly poor measure for volatile commodities.
So by the numbers, we're worse off in gas price terms than we were in 1980 except for minimum-wage earners in New York and Colorado. We are also worse off than we were in 2008, with the same exceptions. The tremendous progress in oil production, refining, distribution and more - progress that led to lower prices through the 90s and after 2012 and significantly from 2017-2019 - has evaporated. A 40 year setback.
And what does this mean for working people who have to buy gas? Assuming a hypothetical national average person, the minimum wage worker must work 41.5 minutes to buy a single gallon of gasoline. The same hypothetical worker at the median wage must work 9 minutes. To fill a 12 gallon gas tank, the minimum wage worker must work for 8.3 hours - more than one entire workday before taxes. To fill that same gas tank, the median wage worker must work for 1.8 hours (again, pretax).
If our national average person consumes 30 gallons of fuel per month on commuting, shopping, school runs, etc. (750 miles per month at 25 MPG), he will need to work around 21 hours at minimum wage, or 12% of his entire work time in the month, assuming full-time employment. If he earns the median, he will need to work 4.6 hours, or 2.7% of his entire work time in the month. Again, taxes come out first so the effective numbers are quite a bit higher.
With the exceptions noted above, this is worse than 2008. This is worse than 1980. If you're a minimum or low wage earner, it's ruinous. If you're a median wage earner, it's very painful. If you're affluent, it still sucks.
If they actually want to help the working class, this administration needs to tear up their energy policies, get the hell out of the way and let oil producers begin the long slog of increasing production. In a couple of years' time - the amount of time it would take to undo these disastrous policies - we can be better off again. As long as they stay in the way, those working people for whom they claim their coal-black hearts bleed will keep being destroyed.
Sources and notes
* Minimum and median wage information is from St. Louis Federal Reserve (FRED) data, except for 1980. 1980 data came from the Census Bureau (FRED does not go back that far).
* Median wage is an annual figure, which was divided by 2,080 (standard working year) to obtain approximate hourly rates.
* Inflation is based on cumulative CPI inflation
* Gas price data sources varies by year.
* 1980 and 1995 use Bureau of Labor Statistics data, which uses census-defined areas for gas price data. This requires the use of a metropolitan area. The metropolitan areas used were "All Cities" (US), Los Angeles (CA), New York City (NY), Miami (FL), Dallas/Fort Worth (TX) and Denver (CO). Of these, the New York data is the least precise because it includes parts of New Jersey and Pennsylvania, which both have higher gas taxes than New York.
* 2008 uses Energy Information Administration data
* For current gas prices (as of June 17), the data come from AAA.

JQ: "I perch myself on the edge of the chair so as not ..."
JackStraw: ">>JackStraw, they do tend to blend in. We have ..."
Quarter Twenty: "That is one dangerous watermelon. Posted by: fd a ..."
TecumsehTea: "JackStraw, they do tend to blend in. ..."
vmom deport deport deport: "Sending love to all the pet moronz and hugs to hoo ..."
JackStraw: ">>We were hiking and our son almost stepped on it. ..."
TecumsehTea: "When our boys were in early teens they had a coupl ..."
fd: ""This might: https://youtu.be/dSNSyioD2Bk Post ..."
Common Tater: "I read somewhere the wind turbines use an expensiv ..."
Quarter Twenty: ">68 Getting a watermelon drunk and taking advantag ..."
"Perfessor" Squirrel: "*sigh* Time to dole out the tender vittles to t ..."
Ace of Spades Pet Thread, July 18
Gardening, Home and Nature Thread, July 18
Saving the Shire
The Classical Saturday Morning Coffee Break & Prayer Revival
Daily Tech News 18 July 2026
Look At Me I'm ONT
Friday Cafe
The Same Media That Pushed Hillary's Fake Opposition Research About Russia Collusion For Six Years Can't Believe Trump Is Alleging Election Irregularities
Scott Bessent: A Deranged Leftist Attempted to Assassinate Me Shortly After I Became Secretary of the Treasury
The New Republic: Don't You Understand You're Forcing Us Lefties to Murder You?
Paul Anka Haiku Contest Announcement
Integrity SAT's: Entrance Exam for Paul Anka's Band
AllahPundit's Paul Anka 45's Collection
AnkaPundit: Paul Anka Takes Over the Site for a Weekend (Continues through to Monday's postings)
George Bush Slices Don Rumsfeld Like an F*ckin' Hammer
Democratic Forays into Erotica
New Shows On Gore's DNC/MTV Network
Nicknames for Potatoes, By People Who Really Hate Potatoes
Star Wars Euphemisms for Self-Abuse
Signs You're at an Iraqi "Wedding Party"
Signs Your Clown Has Gone Bad
Signs That You, Geroge Michael, Should Probably Just Give It Up
Signs of Hip-Hop Influence on John Kerry
NYT Headlines Spinning Bush's Jobs Boom
Things People Are More Likely to Say Than "Did You Hear What Al Franken Said Yesterday?"
Signs that Paul Krugman Has Lost His Frickin' Mind
All-Time Best NBA Players, According to Senator Robert Byrd
Other Bad Things About the Jews, According to the Koran
Signs That David Letterman Just Doesn't Care Anymore
Examples of Bob Kerrey's Insufferable Racial Jackassery
Signs Andy Rooney Is Going Senile
Other Judgments Dick Clarke Made About Condi Rice Based on Her Appearance
Collective Names for Groups of People
John Kerry's Other Vietnam Super-Pets
Cool Things About the XM8 Assault Rifle
Media-Approved Facts About the Democrat Spy
Changes to Make Christianity More "Inclusive"
Secret John Kerry Senatorial Accomplishments
John Edwards Campaign Excuses
John Kerry Pick-Up Lines
Changes Liberal Senator George Michell Will Make at Disney
Torments in Dog-Hell
The Ace of Spades HQ Sex-for-Money Skankathon
A D&D Guide to the Democratic Candidates
Margaret Cho: Just Not Funny
More Margaret Cho Abuse
Margaret Cho: Still Not Funny
Iraqi Prisoner Claims He Was Raped... By Woman
Wonkette Announces "Morning Zoo" Format
John Kerry's "Plan" Causes Surrender of Moqtada al-Sadr's Militia
World Muslim Leaders Apologize for Nick Berg's Beheading
Michael Moore Goes on Lunchtime Manhattan Death-Spree
Milestone: Oliver Willis Posts 400th "Fake News Article" Referencing Britney Spears
Liberal Economists Rue a "New Decade of Greed"
Artificial Insouciance: Maureen Dowd's Word Processor Revolts Against Her Numbing Imbecility
Intelligence Officials Eye Blogs for Tips
They Done Found Us Out, Cletus: Intrepid Internet Detective Figures Out Our Master Plan
Shock: Josh Marshall Almost Mentions Sarin Discovery in Iraq
Leather-Clad Biker Freaks Terrorize Australian Town
When Clinton Was President, Torture Was Cool
What Wonkette Means When She Explains What Tina Brown Means
Wonkette's Stand-Up Act
Wankette HQ Gay-Rumors Du Jour
Here's What's Bugging Me: Goose and Slider
My Own Micah Wright Style Confession of Dishonesty
Outraged "Conservatives" React to the FMA
An On-Line Impression of Dennis Miller Having Sex with a Kodiak Bear
The Story the Rightwing Media Refuses to Report!
Our Lunch with David "Glengarry Glen Ross" Mamet
The House of Love: Paul Krugman
A Michael Moore Mystery (TM)
The Dowd-O-Matic!
Liberal Consistency and Other Myths
Kepler's Laws of Liberal Media Bias
John Kerry-- The Splunge! Candidate
"Divisive" Politics & "Attacks on Patriotism" (very long)
The Donkey ("The Raven" parody)